Figure: Supply Shifts 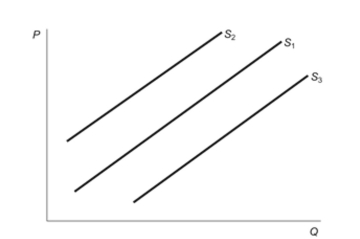 Reference: Ref 3-4 (Figure: Supply Shifts) In the figure, the initial supply curve is S1. Producers engage in market speculation with the belief that the price of the good will increase in the near future. This would be represented in the figure by shifting the:
A) supply curve to S2, resulting in a lower quantity supplied at each price.
B) supply curve to S2, resulting in a higher quantity supplied at each price.
C) supply curve to S3, resulting in a lower quantity supplied at each price.
D) supply curve to S3, resulting in a higher quantity supplied at each price.
Correct Answer:
Verified
Q101: A market has a supply equation as
Q102: A market has a supply equation as
Q103: A market has a demand equation as
Q104: A market has a demand equation as
Q181: Joe runs a landscape company and uses
Q196: A change in price is reflected by
Q219: Consumer surplus can be defined as the
Q230: Advertising, fads, and fashion are examples of
Q232: A change in quantity supplied is reflected
Q234: Suppose that the market price for MP3
Unlock this Answer For Free Now!
View this answer and more for free by performing one of the following actions

Scan the QR code to install the App and get 2 free unlocks

Unlock quizzes for free by uploading documents