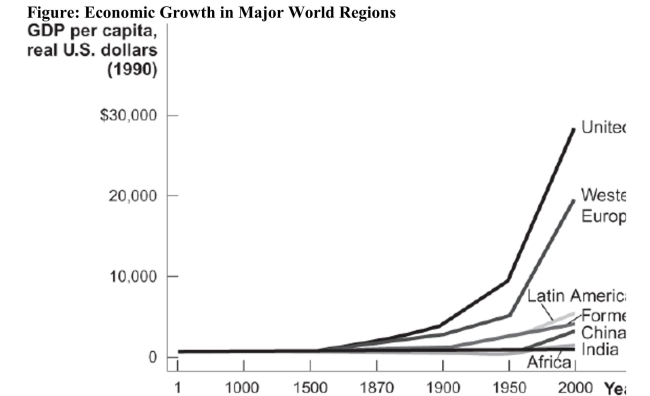
 Reference: Ref 7-2 (Figure: Economic Growth in Major World Regions) Refer to the figure, which shows us how real GDP per capita has been changing over time in different regions and countries of the world. Studying the chart shows I. that growth in Africa has stagnated. II. that the world only saw significant growth in real GDP per capita after 1950. III. that life expectancy has risen tremendously across the world regions.
A) I only
B) II only
C) III only
D) I and II only
Correct Answer:
Verified
Q4: Suppose a country has real GDP of
Q5: What percentage of the world's population lives
Q6: The United States and Western European countries
Q7: In the year 2000, the world's average
Unlock this Answer For Free Now!
View this answer and more for free by performing one of the following actions

Scan the QR code to install the App and get 2 free unlocks

Unlock quizzes for free by uploading documents