
Figure 11.3 The Market for the Euro
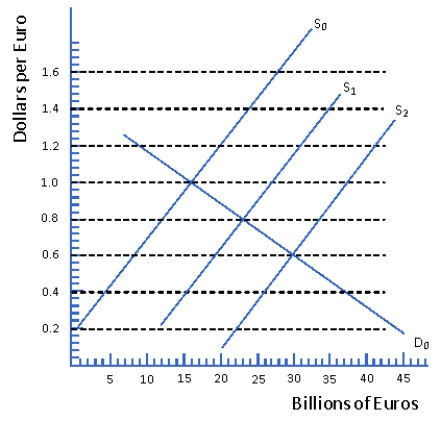
-Refer to Figure 11.3.If the supply curve is represented by S0,the equilibrium exchange rate is
A) $1.20
B) $1.00
C) $0.80
D) $0.60
Correct Answer:
Verified
Q42: Figure 11.1. Supply and Demand Schedules of
Q56: Table 11.4.Forward Exchange Rates Q58: Exhibit 11.1 Assume the following: Q59: Figure 11.1 illustrates the supply and demand Q60: Table 11.2.Supply and Demand of British Pounds Q62: When the dollar depreciates Q65: Table 11.4.Forward Exchange Rates Q142: Most foreign exchange trading is carried out Q147: The bid rate refers to the price Q160: A commercial bank profits from foreign-exchange trading
![]()
(1) the
A) U.S.exporters tend to
![]()
Unlock this Answer For Free Now!
View this answer and more for free by performing one of the following actions

Scan the QR code to install the App and get 2 free unlocks

Unlock quizzes for free by uploading documents