
Figure 14.1US market for Imported Toyotas
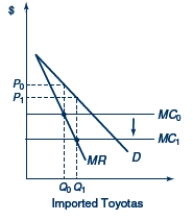
-In Figure 14.1,D represents the US demand curve for Toyotas and MC0 represents the marginal cost of producing Toyotas.A shift in the marginal cost curve from MC0 to MC1 represents
A) an appreciation of the dollar relative to the yen
B) an appreciation of the yen relative to the dollar
C) a depreciation of the dollar relative to the yen
D) neither an appreciation nor a depreciation of the dollar relative to the yen
Correct Answer:
Verified
Q36: Assume that Ford Motor Company obtains all
Q37: The absorption approach to currency depreciation is
Q39: The time period that it takes for
Q40: The J-curve effect implies that following a
Q41: According to the Marshall-Lerner condition, currency depreciation
Q42: The lag that occurs between changes in
Q43: Reversing balance of payments disequilibria may came
Q44: Table 14.1.Hypothetical Costs of Producing an Automobile
Q45: Table 14.1.Hypothetical Costs of Producing an Automobile
Q46: Table 14.1.Hypothetical Costs of Producing an Automobile
Unlock this Answer For Free Now!
View this answer and more for free by performing one of the following actions

Scan the QR code to install the App and get 2 free unlocks

Unlock quizzes for free by uploading documents