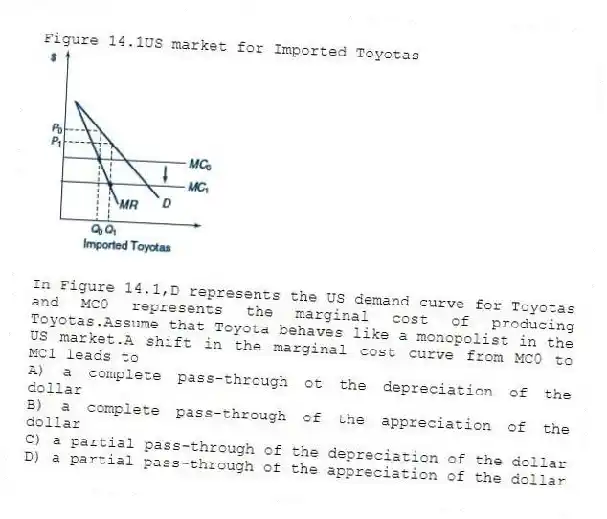
Figure 14.1US market for Imported Toyotas
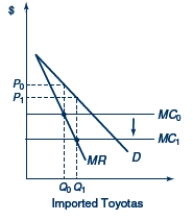
-In Figure 14.1,D represents the US demand curve for Toyotas and MC0 represents the marginal cost of producing Toyotas.Assume that Toyota behaves like a monopolist in the US market.A shift in the marginal cost curve from MC0 to MC1 leads to
A) a complete pass-through ot the depreciation of the dollar
B) a complete pass-through of the appreciation of the dollar
C) a partial pass-through of the depreciation of the dollar
D) a partial pass-through of the appreciation of the dollar
Correct Answer:
Verified
Q43: Reversing balance of payments disequilibria may came
Q44: Table 14.1.Hypothetical Costs of Producing an Automobile
Q45: Table 14.1.Hypothetical Costs of Producing an Automobile
Q46: Table 14.1.Hypothetical Costs of Producing an Automobile
Q47: The analysis of the effects of currency
Q49: The absorption approach to currency depreciation focuses
Q50: The Marshall-Lerner condition suggests that depreciation of
Q51: Figure 14.2The US Market for Imported Toyotas
Q52: Table 14.1.Hypothetical Costs of Producing an Automobile
Q53: The time period that it takes for
Unlock this Answer For Free Now!
View this answer and more for free by performing one of the following actions

Scan the QR code to install the App and get 2 free unlocks

Unlock quizzes for free by uploading documents