The figure shows the speedometer readings as a car comes to a stop. Solve graphically for the acceleration ax at t = 7.0 s. 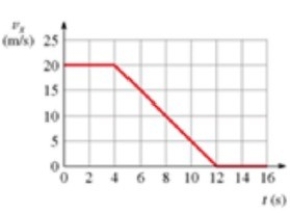
A) 2.5 m/s2
B) − 2.5 m/s2
C) − 2.0 m/s2
D) 2.0 m/s2
Correct Answer:
Verified
Q33: A car starts from rest and travels
Q34: The graph shows vx versus t for
Q35: A car traveling at 3.0 m/s has
Q36: A car starts from rest and travels
Q37: A boat is traveling at 4.0 m/s
Q39: An object starts from rest with an
Q40: A 4.0 kg mass has a velocity
Q41: You drive your car 5.0 km due
Q42: A ball is thrown upward with a
Q43: A ball is thrown straight up with
Unlock this Answer For Free Now!
View this answer and more for free by performing one of the following actions

Scan the QR code to install the App and get 2 free unlocks

Unlock quizzes for free by uploading documents