The figure shows the graph of vx versus time for an object moving along the x-axis. Solve graphically for the average acceleration between t = 5.0 s and t = 9.0 s. 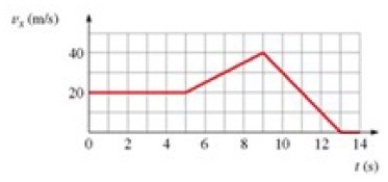
A) 4.0 m/s2
B) 5.0 m/s2
C) 0.5 m/s2
D) 0.4 m/s2
Correct Answer:
Verified
Q41: You drive your car 5.0 km due
Q42: A ball is thrown upward with a
Q43: A ball is thrown straight up with
Q44: Human reaction time is usually greater than
Q45: A ball is thrown straight up with
Q47: A baseball is pitched, reaching the batter
Q48: A bullet shot straight up returns to
Q49: A ball is thrown downward from the
Q50: A sprinter runs 100.0 m. If he
Q51: Ball A is dropped from the top
Unlock this Answer For Free Now!
View this answer and more for free by performing one of the following actions

Scan the QR code to install the App and get 2 free unlocks

Unlock quizzes for free by uploading documents