Multiple Choice
Graph 22-8
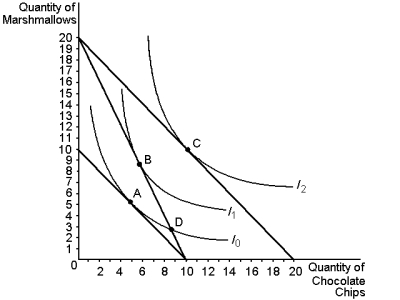
-Refer to Graph 22-8. Assume that the consumer depicted in the graph has an income of $20. Using the information above, which of the following price-quantity combinations would be on her demand curve for marshmallows if the price of chocolate chips is $2?
A) $1, eight
B) $1, 14
C) $2, seven
D) $2, three
Correct Answer:
Verified
Related Questions

