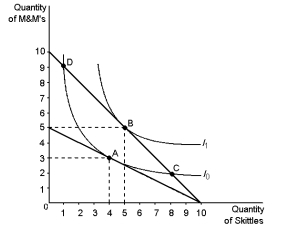
Using the graph shown, construct a demand curve for M&Ms, given an income of $10.
Correct Answer:
Verified
Q117: Graphically demonstrate the conditions associated with a
Q123: The substitution effect from an increase in
Q141: Use a graph to demonstrate how an
Q143: A person consumes two goods: Coke and
Q146: Jonathan is planning ahead for retirement and
Q150: Frida and Brent, two economists working on
Q151: Draw a budget constraint that is consistent
Q153: Using indifference curves and budget constraints, graphically
Q154: Suppose you win a 'grocery-grab' at your
Q161: Use a diagram to demonstrate the circumstances
Unlock this Answer For Free Now!
View this answer and more for free by performing one of the following actions

Scan the QR code to install the App and get 2 free unlocks

Unlock quizzes for free by uploading documents