Graph 15-2
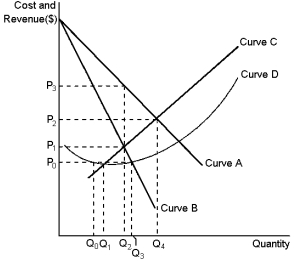 This graph reflects the cost and revenue structure for a monopoly firm. Use the graph to answer the following question(s) .
-Refer to Graph 15-2. The number of consumers who did not buy the good despite a willingness-to-pay greater than marginal cost is given by:
A) Q2 - Q0
B) Q3 - Q1
C) Q4 - Q1
D) Q4 - Q2
Correct Answer:
Verified
Q142: Graph 15-2 Q145: A firm's supply curve in a competitive Q148: Graph 15-2 Q150: Suppose a pesticide company discovers and patents Q152: Supply curves tell us how much producers Q154: Graph 15-2 Q156: Graph 15-3 Q162: For a monopoly market, total surplus can Q163: In a monopoly, consumers will purchase if Q174: Graph 15-3 Unlock this Answer For Free Now! View this answer and more for free by performing one of the following actions Scan the QR code to install the App and get 2 free unlocks Unlock quizzes for free by uploading documents![]()
![]()
![]()
![]()
![]()

