Consider the following graph of a monopoly.
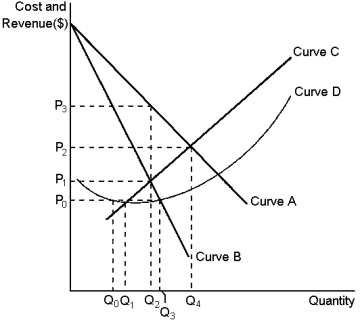
Use the graph to identify the marginal-revenue curve, the average-revenue curve, the average-total-cost curve and the marginal-cost curve. Then identify the price a profit-maximising monopolist would charge and the output it would produce.
Correct Answer:
Verified
View Answer
Unlock this answer now
Get Access to more Verified Answers free of charge
Q128: Graphically depict the deadweight loss caused by
Q150: Consider the following graph of a monopoly.
Q182: Graph 15-6 Q190: Graph 15-6 Q191: Graph 15-6 Q200: Round-trip airline tickets are usually cheaper if Q202: Calculate the deadweight loss due to profit-maximising Q207: Price discrimination explains why high-ranking universities often Q208: Perfect price discrimination leads to zero consumer Q212: When AT&T had a monopoly on telephones Unlock this Answer For Free Now! View this answer and more for free by performing one of the following actions Scan the QR code to install the App and get 2 free unlocks Unlock quizzes for free by uploading documents![]()
![]()
![]()

