Multiple Choice
Graph 14-4
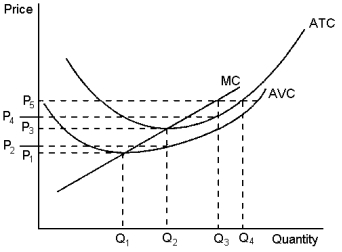 The graph depicts the cost structure of a firm in a competitive market. Use the graph to answer the following question(s) .
-Refer to Graph 14-4. When market price is P2, a profit-maximising firm's losses can be represented by the area:
A) (P3 - P2) *Q2
B) (P2 - P1) *Q2
C) at a market price of P2, the firm does not have losses
D) at a market price of P2, the firm has losses, but the reference points in the graph don't identify the losses
Correct Answer:
Verified
Related Questions
Q80: When profit-maximising firms in competitive markets are

