Multiple Choice
Graph 14-5
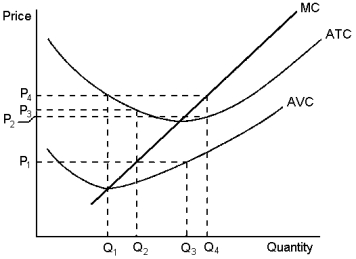 This graph depicts the cost structure of a firm in a competitive market. Use the graph to answer the following question(s) .
-Refer to Graph 14-5. When market price is P1, a profit-maximising firm's total revenue can be represented by the area:
A) P3 * Q2
B) P1 * Q3
C) P1 * Q2
D) P2* Q2
Correct Answer:
Verified
Related Questions

