Graph 13-3
 The set of curves above reflect information about the cost structure of a firm. Use this graph to answer the following question(s) .
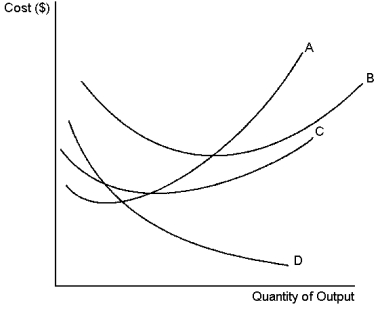
-Refer to Graph 13-3. Which of the curves is most likely to represent average variable cost?
A) A
B) B
C) C
D) D
Correct Answer:
Verified
Q84: Graph 13-4 Q85: Graph 13-2 Q87: Graph 13-3 Q96: Average total cost equals: Q105: The efficient scale of a firm is Q110: The marginal cost curve crosses the average Q114: The efficient scale of the firm is Q115: At low output levels a firm's average Q123: In the long run: Q129: The long-run average total cost curve is: Unlock this Answer For Free Now! View this answer and more for free by performing one of the following actions Scan the QR code to install the App and get 2 free unlocks Unlock quizzes for free by uploading documents
![]()
![]()
![]()
A)change in total costs
A)variable inputs are rarely
A)flatter

