Graph 13-4
 This graph depicts average total cost functions for a firm that produces automobiles. Use the graph to answer the following question(s) .
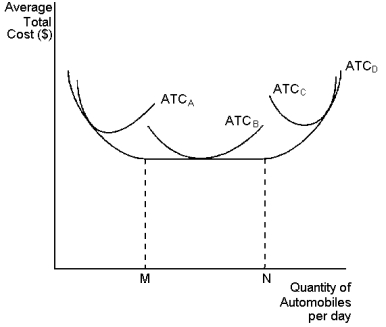
-Refer to Graph 13-4. This firm experiences constant returns to scale at which output levels?
A) output levels above N
B) output levels between M and N
C) output levels below M
D) all of the above levels if the firm is operating in the long run
Correct Answer:
Verified
Q96: Graph 13-3 Q97: Graph 13-4 Q99: Graph 13-3 Q106: The average total cost curve is increasing Q138: When a factory is operating in the Q142: Economies of scale arise when: Q143: Table 13-2 Q144: Constant returns to scale occur when: Q148: Table 13-1 Q153: Table 13-1 Unlock this Answer For Free Now! View this answer and more for free by performing one of the following actions Scan the QR code to install the App and get 2 free unlocks Unlock quizzes for free by uploading documents
![]()
![]()
![]()
A)workers are able
Adrienne's Premium Boxing Service subcontracts with
A)long-run average
Measures of Cost for Splashy Cardboard
Measures of Cost for Splashy Cardboard

