Multiple Choice
Graph 13-4
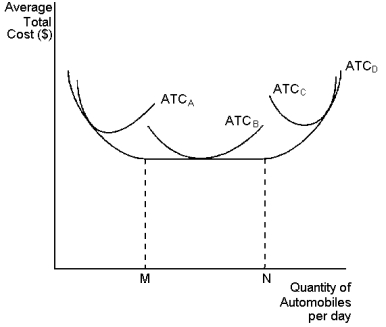 This graph depicts average total cost functions for a firm that produces automobiles. Use the graph to answer the following question(s) .
-Refer to Graph 13-4. At levels of output below point M, the firm experiences:
A) economies of scale
B) accounting profit
C) economic profit
D) diseconomies of scale
Correct Answer:
Verified
Related Questions

