Graph 10-1
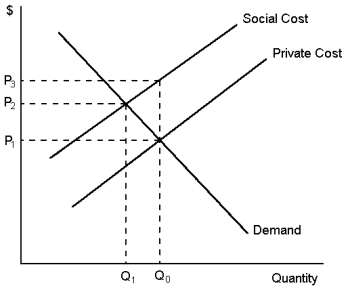
-Refer to Graph 10-1. In the figure shown, an optimal government policy would be a tax on production to the value of:
A) P3 - P1
B) P3 - P2
C) P3 - P1.
D) The value of the optimal tax cannot be measured
Correct Answer:
Verified
Q21: Government policies to encourage technology spillovers may
Q27: Social welfare can be enhanced by allowing
Q33: When there are transaction costs to resolving
Q47: Graph 10-2 Q48: When a tax is used to give Q56: Airports can generate a negative externality with Q59: A positive externality exists when: Q69: Suppose that a fish-food manufacturing company is Q70: Graph 10-1 Q72: Tom is very tall.When he goes to
![]()
A)a person engages![]()
Unlock this Answer For Free Now!
View this answer and more for free by performing one of the following actions

Scan the QR code to install the App and get 2 free unlocks

Unlock quizzes for free by uploading documents