Graph 10-2
 This graph reflects the market for kiwifruit, where pesticide used by kiwifruit orchardists also unintentionally kills honey bees.
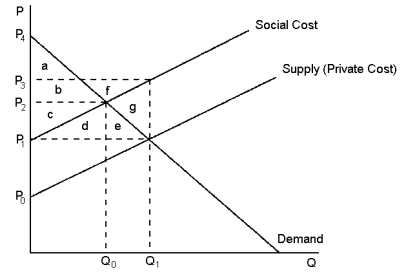
-Refer to Graph 10-2. The difference between the social cost curve and the supply curve reflects the:
A) profit margin of each kiwifruit tray
B) cost of spillover effects from the kiwifruit orchards (replacing bees, lost honey output)
C) value of kiwifruit to society as a whole
D) amount by which the government should subsidise the kiwifruit orchardists
Correct Answer:
Verified
Q42: Graph 10-1 Q59: A positive externality exists when: Q62: A ???_ is enacted to correct the Q63: Graph 10-1 Q67: To produce honey, beekeepers place hives of Q69: Suppose that a fish-food manufacturing company is Unlock this Answer For Free Now! View this answer and more for free by performing one of the following actions Scan the QR code to install the App and get 2 free unlocks Unlock quizzes for free by uploading documents
![]()
A)a person engages
![]()

