The figure shows a molecular-level representation of the following voltaic cell: Fe(s) + Ni2+(aq) → Fe2+(aq) + Ni(s) When drawing the "after" representation one would note that 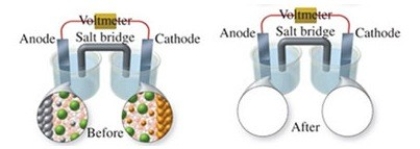
A) the nickel electrode will be smaller.
B) the iron electrode will be larger.
C) the number of Ni2+ ions in solution will decrease.
D) deposits will form in the salt bridge.
E) the number of Fe2+ ions in solution will remain constant.
Correct Answer:
Verified
Q63: A voltaic cell is prepared in which
Q64: The following reaction occurs in acid solution.
Q65: A mercury button battery that is used
Q66: The following reaction occurs in a lead
Q67: A lead-acid battery that is used in
Q69: The reaction that occurs in an alkaline
Q70: A voltaic cell is prepared in which
Q71: The figure shows a molecular-level representation of
Q72: The following reaction occurs in acid solution.
Q73: A voltaic cell is prepared in which
Unlock this Answer For Free Now!
View this answer and more for free by performing one of the following actions

Scan the QR code to install the App and get 2 free unlocks

Unlock quizzes for free by uploading documents