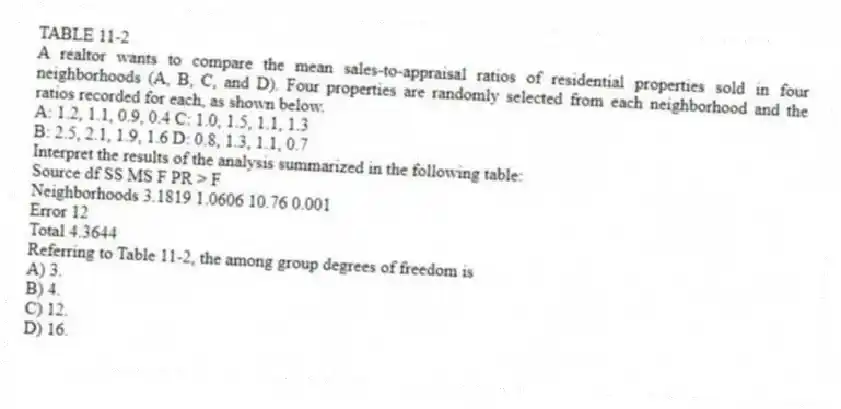
TABLE 11-2
A realtor wants to compare the mean sales-to-appraisal ratios of residential properties sold in four neighborhoods (A, B, C, and D) . Four properties are randomly selected from each neighborhood and the ratios recorded for each, as shown below.
A: 1.2, 1.1, 0.9, 0.4 C: 1.0, 1.5, 1.1, 1.3
B: 2.5, 2.1, 1.9, 1.6 D: 0.8, 1.3, 1.1, 0.7
Interpret the results of the analysis summarized in the following table:
Source df SS MS F PR > F
Neighborhoods 3.1819 1.0606 10.76 0.001
Error 12
Total 4.3644
-Referring to Table 11-2, the among group degrees of freedom is
A) 3.
B) 4.
C) 12.
D) 16.
Correct Answer:
Verified
Q1: The analysis of variance (ANOVA)tests hypotheses about
Q5: In a one-way ANOVA, if the computed
Q8: TABLE 11-1
An airline wants to select a
Q9: TABLE 11-2
A realtor wants to compare the
Q10: TABLE 11-1
An airline wants to select a
Q13: In a one-factor ANOVA analysis,the among sum
Q16: When the F test is used for
Q18: The F test statistic in a one-way
Q19: If you are comparing the mean sales
Q20: An airline wants to select a computer
Unlock this Answer For Free Now!
View this answer and more for free by performing one of the following actions

Scan the QR code to install the App and get 2 free unlocks

Unlock quizzes for free by uploading documents