TABLE 11-12
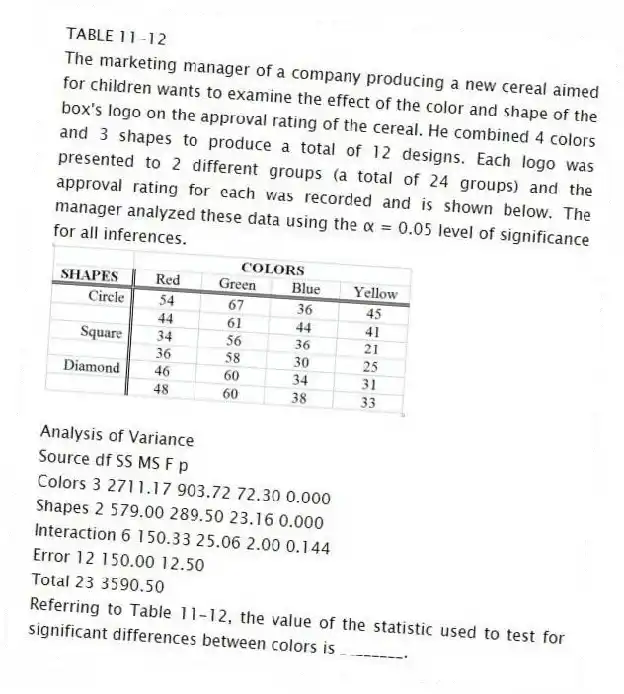
The marketing manager of a company producing a new cereal aimed for children wants to examine the effect of the color and shape of the box's logo on the approval rating of the cereal. He combined 4 colors and 3 shapes to produce a total of 12 designs. Each logo was presented to 2 different groups (a total of 24 groups) and the approval rating for each was recorded and is shown below. The manager analyzed these data using the α = 0.05 level of significance for all inferences.

Analysis of Variance
Source df SS MS F p
Colors 3 2711.17 903.72 72.30 0.000
Shapes 2 579.00 289.50 23.16 0.000
Interaction 6 150.33 25.06 2.00 0.144
Error 12 150.00 12.50
Total 23 3590.50
-Referring to Table 11-12, the value of the statistic used to test for significant differences between colors is ________.
Correct Answer:
Verified
Q196: TABLE 11-11
A physician and president of a
Q197: TABLE 11-11
A physician and president of a
Q198: TABLE 11-10
A campus researcher wanted to investigate
Q199: TABLE 11-10
A campus researcher wanted to investigate
Q200: TABLE 11-11
A physician and president of a
Q202: TABLE 11-12
The marketing manager of a company
Q203: TABLE 11-12
The marketing manager of a company
Q204: TABLE 11-12
The marketing manager of a company
Q205: TABLE 11-12
The marketing manager of a company
Q206: TABLE 11-12
The marketing manager of a company
Unlock this Answer For Free Now!
View this answer and more for free by performing one of the following actions

Scan the QR code to install the App and get 2 free unlocks

Unlock quizzes for free by uploading documents