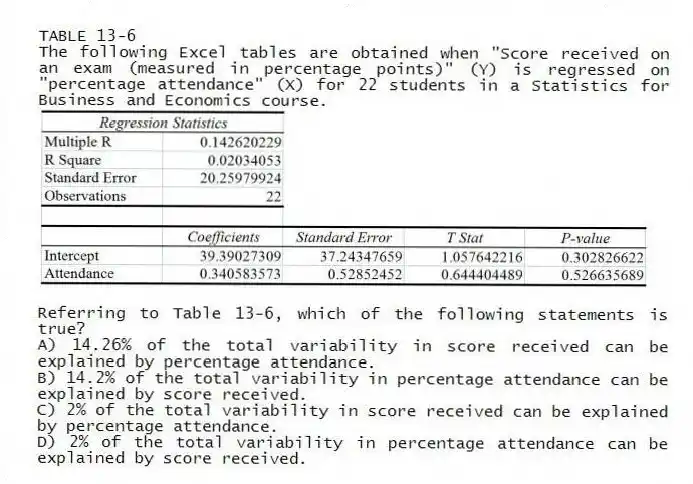
TABLE 13-6
The following Excel tables are obtained when "Score received on an exam (measured in percentage points) " (Y) is regressed on "percentage attendance" (X) for 22 students in a Statistics for Business and Economics course.
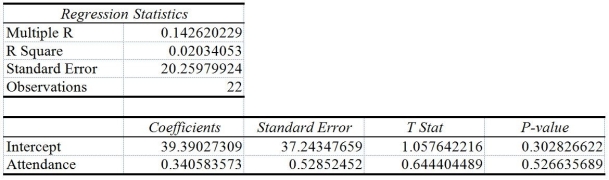
-Referring to Table 13-6, which of the following statements is true?
A) 14.26% of the total variability in score received can be explained by percentage attendance.
B) 14.2% of the total variability in percentage attendance can be explained by score received.
C) 2% of the total variability in score received can be explained by percentage attendance.
D) 2% of the total variability in percentage attendance can be explained by score received.
Correct Answer:
Verified
Q85: TABLE 13-5
The managing partner of an advertising
Q85: In performing a regression analysis involving two
Q86: Data that exhibit an autocorrelation effect violate
Q87: TABLE 13-6
The following Excel tables are obtained
Q88: Based on the residual plot below, you
Q89: Which of the following assumptions concerning the
Q93: The coefficient of determination represents the ratio
Q94: If the residuals in a regression analysis
Q99: Regression analysis is used for prediction,while correlation
Q100: The Durbin-Watson D statistic is used to
Unlock this Answer For Free Now!
View this answer and more for free by performing one of the following actions

Scan the QR code to install the App and get 2 free unlocks

Unlock quizzes for free by uploading documents