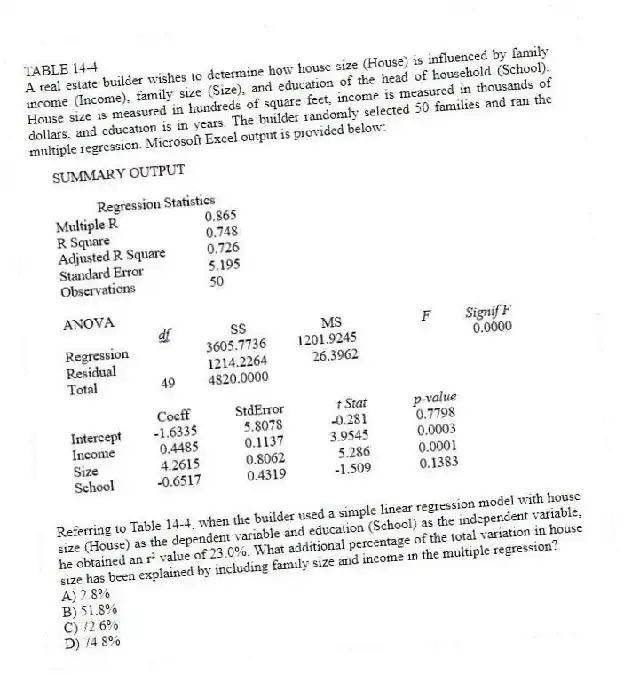
TABLE 14-4
A real estate builder wishes to determine how house size (House) is influenced by family income (Income) , family size (Size) , and education of the head of household (School) . House size is measured in hundreds of square feet, income is measured in thousands of dollars, and education is in years. The builder randomly selected 50 families and ran the multiple regression. Microsoft Excel output is provided below: 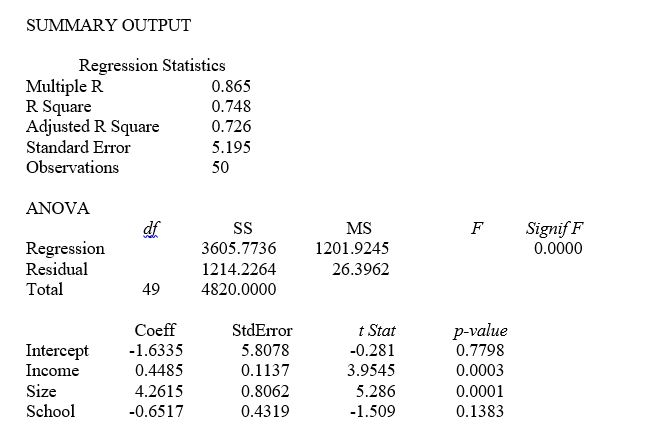
-Referring to Table 14-4, when the builder used a simple linear regression model with house size (House) as the dependent variable and education (School) as the independent variable, he obtained an r² value of 23.0%. What additional percentage of the total variation in house size has been explained by including family size and income in the multiple regression?
A) 2.8%
B) 51.8%
C) 72.6%
D) 74.8%
Correct Answer:
Verified
Q18: TABLE 14-2
A professor of industrial relations believes
Q19: TABLE 14-3
An economist is interested to see
Q20: In a multiple regression model, which of
Q21: TABLE 14-4
A real estate builder wishes to
Q22: TABLE 14-3
An economist is interested to see
Q24: TABLE 14-4
A real estate builder wishes to
Q25: TABLE 14-4
A real estate builder wishes to
Q26: TABLE 14-3
An economist is interested to see
Q27: TABLE 14-3
An economist is interested to see
Q28: TABLE 14-4
A real estate builder wishes to
Unlock this Answer For Free Now!
View this answer and more for free by performing one of the following actions

Scan the QR code to install the App and get 2 free unlocks

Unlock quizzes for free by uploading documents