TABLE 14-15
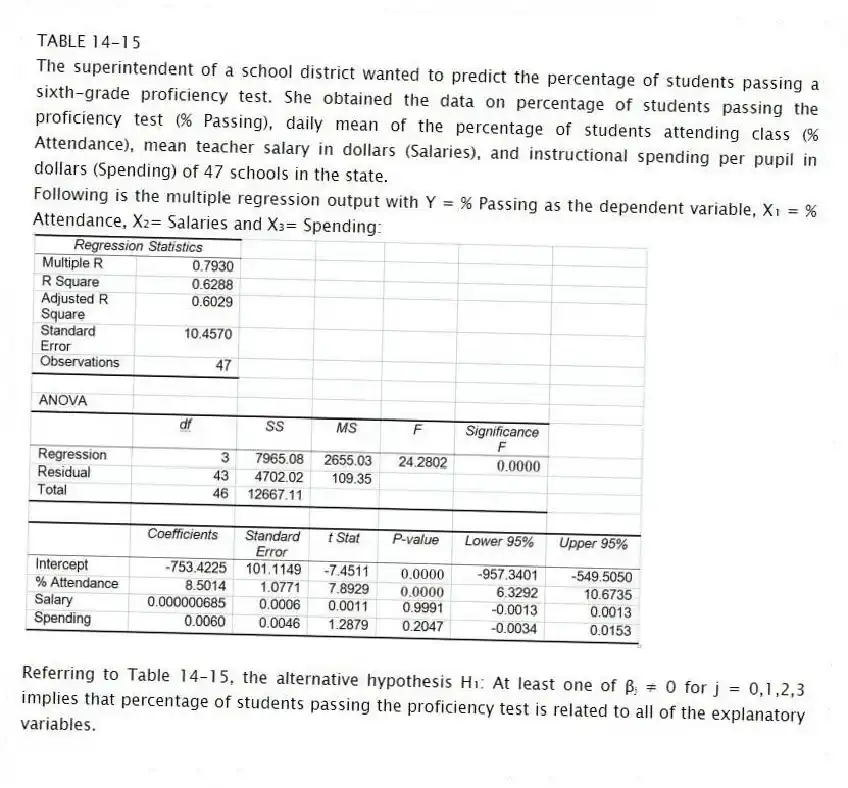
The superintendent of a school district wanted to predict the percentage of students passing a sixth-grade proficiency test. She obtained the data on percentage of students passing the proficiency test (% Passing), daily mean of the percentage of students attending class (% Attendance), mean teacher salary in dollars (Salaries), and instructional spending per pupil in dollars (Spending) of 47 schools in the state.
Following is the multiple regression output with Y = % Passing as the dependent variable, X₁ = % Attendance, X₂= Salaries and X₃= Spending:

-Referring to Table 14-15, the alternative hypothesis H₁: At least one of βⱼ ≠ 0 for j = 0,1,2,3 implies that percentage of students passing the proficiency test is related to all of the explanatory variables.
Correct Answer:
Verified
Q180: TABLE 14-15
The superintendent of a school district
Q181: TABLE 14-15
The superintendent of a school district
Q182: TABLE 14-15
The superintendent of a school district
Q183: TABLE 14-15
The superintendent of a school district
Q184: TABLE 14-15
The superintendent of a school district
Q186: TABLE 14-15
The superintendent of a school district
Q187: TABLE 14-15
The superintendent of a school district
Q188: TABLE 14-15
The superintendent of a school district
Q189: TABLE 14-15
The superintendent of a school district
Q190: TABLE 14-15
The superintendent of a school district
Unlock this Answer For Free Now!
View this answer and more for free by performing one of the following actions

Scan the QR code to install the App and get 2 free unlocks

Unlock quizzes for free by uploading documents