TABLE 14-15
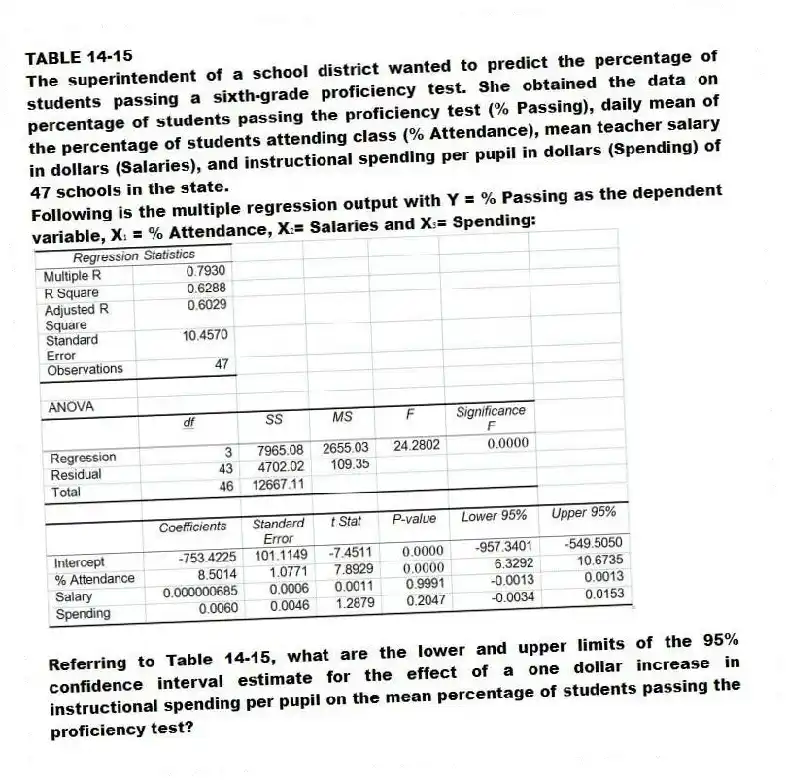
The superintendent of a school district wanted to predict the percentage of students passing a sixth-grade proficiency test. She obtained the data on percentage of students passing the proficiency test (% Passing), daily mean of the percentage of students attending class (% Attendance), mean teacher salary in dollars (Salaries), and instructional spending per pupil in dollars (Spending) of 47 schools in the state.
Following is the multiple regression output with Y = % Passing as the dependent variable, X₁ = % Attendance, X₂= Salaries and X₃= Spending:

-Referring to Table 14-15, what are the lower and upper limits of the 95% confidence interval estimate for the effect of a one dollar increase in instructional spending per pupil on the mean percentage of students passing the proficiency test?
Correct Answer:
Verified
View Answer
Unlock this answer now
Get Access to more Verified Answers free of charge
Q197: TABLE 14-15
The superintendent of a school district
Q198: TABLE 14-15
The superintendent of a school district
Q199: TABLE 14-15
The superintendent of a school district
Q200: TABLE 14-15
The superintendent of a school district
Q201: TABLE 14-15
The superintendent of a school district
Q203: TABLE 14-16
What are the factors that determine
Q204: TABLE 14-15
The superintendent of a school district
Q205: TABLE 14-15
The superintendent of a school district
Q206: TABLE 14-15
The superintendent of a school district
Q207: TABLE 14-15
The superintendent of a school district
Unlock this Answer For Free Now!
View this answer and more for free by performing one of the following actions

Scan the QR code to install the App and get 2 free unlocks

Unlock quizzes for free by uploading documents