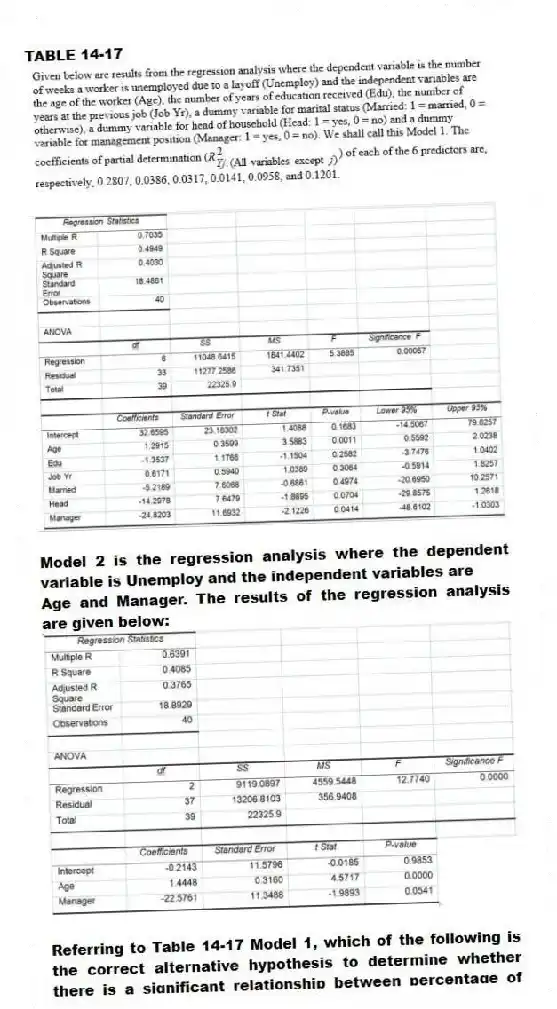
Solved

TABLE 14-17 Model 2 Is the Regression Analysis Where the Dependent Variable

Question 275

Multiple Choice
TABLE 14-17
  
  
Model 2 is the regression analysis where the dependent variable is Unemploy and the independent variables are
Age and Manager. The results of the regression analysis are given below:
 
-Referring to Table 14-17 Model 1, which of the following is the correct alternative hypothesis to determine whether there is a significant relationship between percentage of students passing the proficiency test and the entire set of explanatory variables?
A) H₁: All βⱼ ≠ 0 for j = 0, 1, 2, 3, 4, 5, 6 
B) H₁: All βⱼ ≠ 0 for j = 1, 2, 3, 4, 5, 6 
C) H₁: At least one of βⱼ ≠ 0 for j = 0, 1, 2, 3, 4, 5, 6 
D) H₁: At least one of βⱼ ≠ 0 for j = 1, 2, 3, 4, 5, 6

TABLE 14-17
TABLE 14-17         Model 2 is the regression analysis where the dependent variable is Unemploy and the independent variables are Age and Manager. The results of the regression analysis are given below:    -Referring to Table 14-17 Model 1, which of the following is the correct alternative hypothesis to determine whether there is a significant relationship between percentage of students passing the proficiency test and the entire set of explanatory variables? A)  H₁: All βⱼ ≠ 0 for j = 0, 1, 2, 3, 4, 5, 6 B)  H₁: All βⱼ ≠ 0 for j = 1, 2, 3, 4, 5, 6 C)  H₁: At least one of βⱼ ≠ 0 for j = 0, 1, 2, 3, 4, 5, 6 D)  H₁: At least one of βⱼ ≠ 0 for j = 1, 2, 3, 4, 5, 6
Model 2 is the regression analysis where the dependent variable is Unemploy and the independent variables are
Age and Manager. The results of the regression analysis are given below:
TABLE 14-17         Model 2 is the regression analysis where the dependent variable is Unemploy and the independent variables are Age and Manager. The results of the regression analysis are given below:    -Referring to Table 14-17 Model 1, which of the following is the correct alternative hypothesis to determine whether there is a significant relationship between percentage of students passing the proficiency test and the entire set of explanatory variables? A)  H₁: All βⱼ ≠ 0 for j = 0, 1, 2, 3, 4, 5, 6 B)  H₁: All βⱼ ≠ 0 for j = 1, 2, 3, 4, 5, 6 C)  H₁: At least one of βⱼ ≠ 0 for j = 0, 1, 2, 3, 4, 5, 6 D)  H₁: At least one of βⱼ ≠ 0 for j = 1, 2, 3, 4, 5, 6
-Referring to Table 14-17 Model 1, which of the following is the correct alternative hypothesis to determine whether there is a significant relationship between percentage of students passing the proficiency test and the entire set of explanatory variables?


A) H₁: All βⱼ ≠ 0 for j = 0, 1, 2, 3, 4, 5, 6
B) H₁: All βⱼ ≠ 0 for j = 1, 2, 3, 4, 5, 6
C) H₁: At least one of βⱼ ≠ 0 for j = 0, 1, 2, 3, 4, 5, 6
D) H₁: At least one of βⱼ ≠ 0 for j = 1, 2, 3, 4, 5, 6

Correct Answer:

verifed

Verified

Unlock this answer now
Get Access to more Verified Answers free of charge

Related Questions

Unlock this Answer For Free Now!

View this answer and more for free by performing one of the following actions

qr-code

Scan the QR code to install the App and get 2 free unlocks

upload documents

Unlock quizzes for free by uploading documents