Multiple Choice
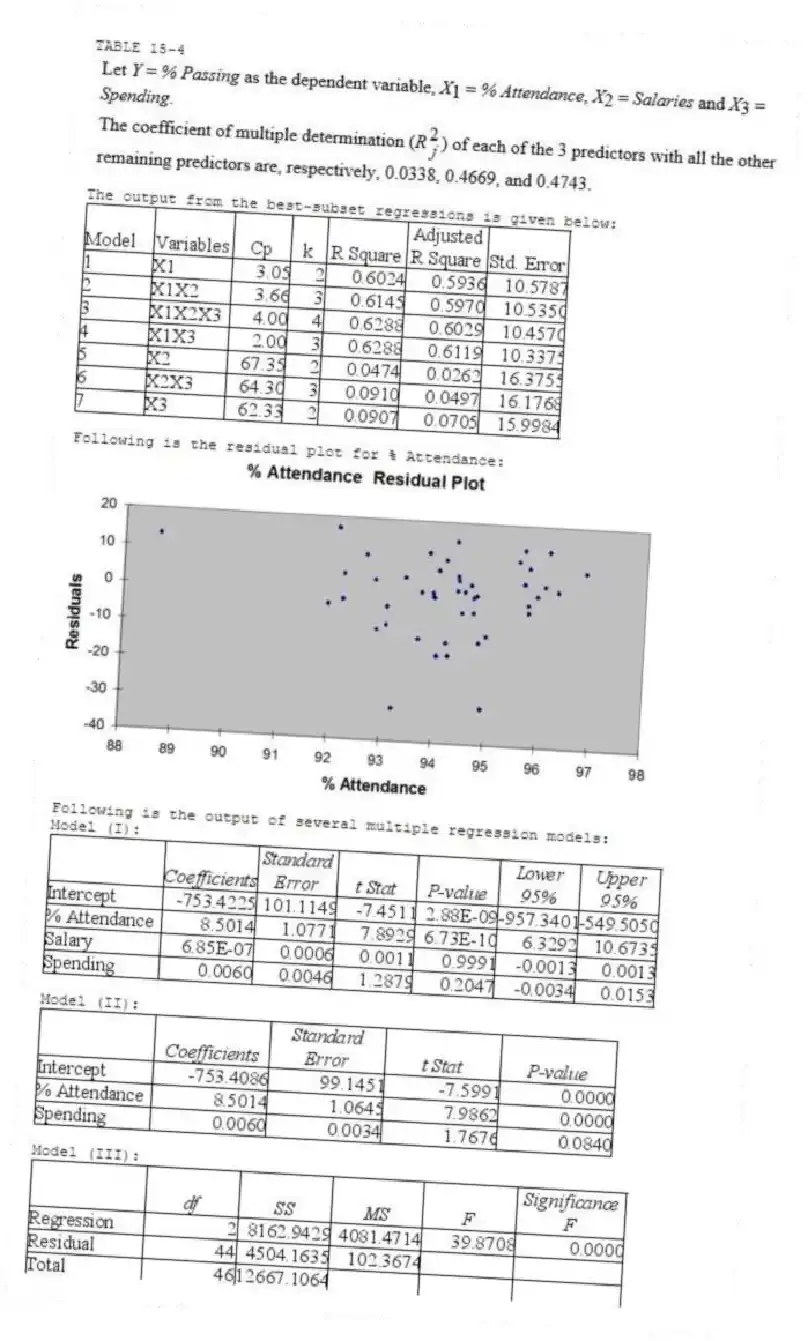
TABLE 15-4

The output from the best-subset regressions is given below:

Following is the residual plot for % Attendance:

Following is the output of several multiple regression models:
Model (I) :

Model (II) :

Model (III) :

-Referring to Table 15-4, the "best" model using a 5% level of significance among those chosen by the Cp statistic is
A) X₁,X₃.
B) X₁,X₂,X₃.
C) Either of the above
D) None of the above
Correct Answer:
Verified
Related Questions
Unlock this Answer For Free Now!
View this answer and more for free by performing one of the following actions

Scan the QR code to install the App and get 2 free unlocks

Unlock quizzes for free by uploading documents