TABLE 17-2
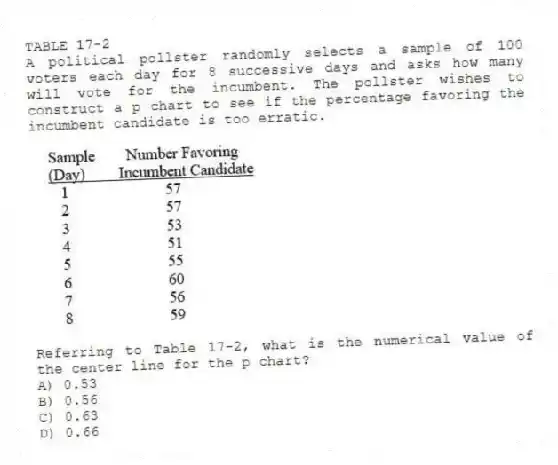
A political pollster randomly selects a sample of 100 voters each day for 8 successive days and asks how many will vote for the incumbent. The pollster wishes to construct a p chart to see if the percentage favoring the incumbent candidate is too erratic. 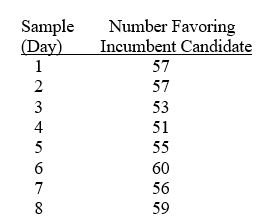
-Referring to Table 17-2, what is the numerical value of the center line for the p chart?
A) 0.53
B) 0.56
C) 0.63
D) 0.66
Correct Answer:
Verified
Q1: TABLE 17-2
A political pollster randomly selects a
Q1: Variation signaled by individual fluctuations or patterns
Q2: TABLE 17-1
A local newspaper has 10 delivery
Q2: Which of the following situations suggests a
Q4: One of the morals of the red
Q6: The control chart
A)focuses on the time dimension
Q8: TABLE 17-2
A political pollster randomly selects a
Q9: TABLE 17-3
A quality control analyst for a
Q14: Once the control limits are set for
Q16: The principal focus of the control chart
Unlock this Answer For Free Now!
View this answer and more for free by performing one of the following actions

Scan the QR code to install the App and get 2 free unlocks

Unlock quizzes for free by uploading documents