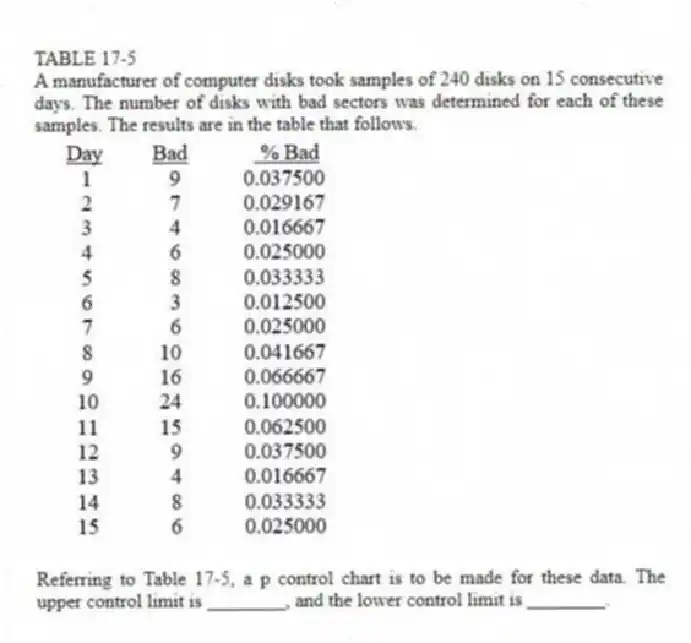
TABLE 17-5
A manufacturer of computer disks took samples of 240 disks on 15 consecutive days. The number of disks with bad sectors was determined for each of these samples. The results are in the table that follows. 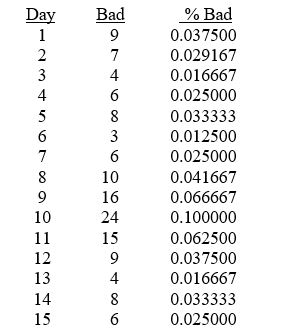
-Referring to Table 17-5, a p control chart is to be made for these data. The upper control limit is ________, and the lower control limit is ________.
Correct Answer:
Verified
Q40: Referring to Table 17-3, suppose the analyst
Q43: It is not possible for the
Q43: The cause of variation that can be
Q44: TABLE 17-5
A manufacturer of computer disks took
Q46: TABLE 17-5
A manufacturer of computer disks took
Q47: The purpose of a control chart is
Q49: TABLE 17-5
A manufacturer of computer disks took
Q50: TABLE 17-6
The maker of a packaged candy
Q57: Changes in the system to reduce common
Q58: _ causes of variation are correctable without
Unlock this Answer For Free Now!
View this answer and more for free by performing one of the following actions

Scan the QR code to install the App and get 2 free unlocks

Unlock quizzes for free by uploading documents