(Figure: Interpreting Aggregate Shifts) The graph shows a(n) 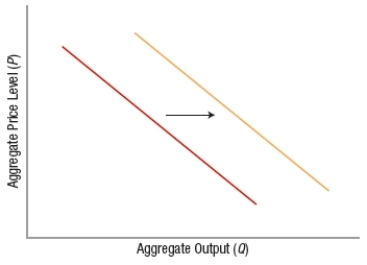
A) decrease in aggregate quantity supplied.
B) increase in aggregate quantity supplied.
C) decrease in aggregate demand.
D) increase in aggregate demand.
Correct Answer:
Verified
Q138: Short-run macroeconomic equilibrium occurs at the intersection
Q139: The _ measure(s) the proportion of additional
Q140: Ceteris paribus, a decrease in imports will
Q141: If the economy shown in the figure
Q142: Demand-pull inflation results when consumers, businesses, and
Q144: If an economy is on the vertical
Q145: (Figure: Understanding Aggregate Graphs) Q146: An increase in investment will cause the Q147: Which event would reduce short-run aggregate supply Q148: (Figure: Determining SRAS Shifts 2) ![]()

Unlock this Answer For Free Now!
View this answer and more for free by performing one of the following actions

Scan the QR code to install the App and get 2 free unlocks

Unlock quizzes for free by uploading documents