(Graph: Consumption) Based on the information provided in the graph, when income equals $1,000, the average propensity to save equals 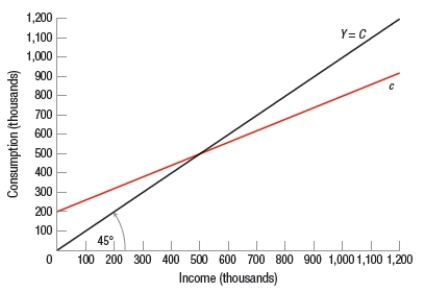
A) 0.2.
B) 0.4.
C) 0.5.
D) 0.6.
Correct Answer:
Verified
Q87: The average propensity to save is calculated
Q88: Suppose the government believes consumers should spend
Q89: If the marginal propensity to consume is
Q90: (Figure: Consumption Spending) At point A in
Q91: If the amount of spending in an
Q93: The largest component of aggregate expenditures is
A)
Q94: The 45-degree line in the Keynesian model
Q95: Which country had the lowest national savings
Q96: If the marginal propensity to consume is
Q97: If the marginal propensity to consume (MPC)
Unlock this Answer For Free Now!
View this answer and more for free by performing one of the following actions

Scan the QR code to install the App and get 2 free unlocks

Unlock quizzes for free by uploading documents