(Figure: Simple Keynesian Model) Based on the figure, which graph would BEST represent the associated saving-investment? 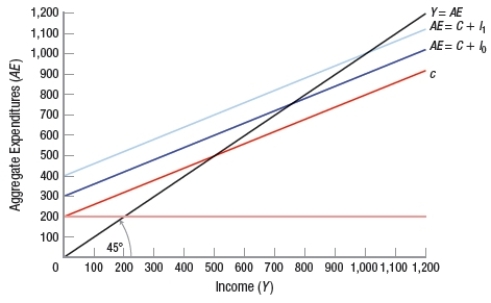
A) 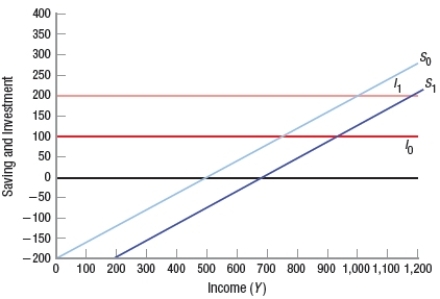
B) 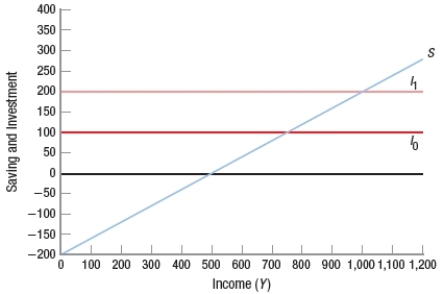
C) 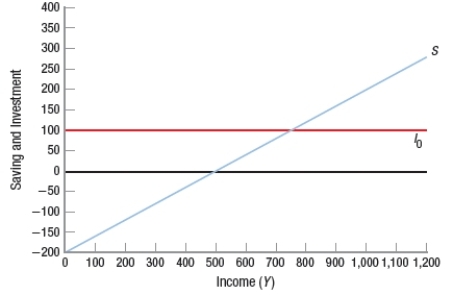
D) 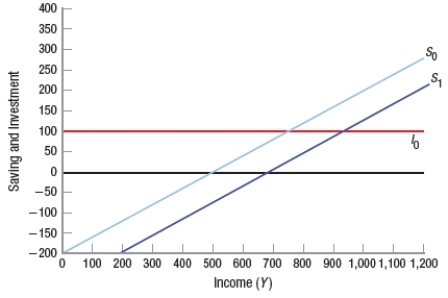
Correct Answer:
Verified
Q237: If autonomous investment spending falls by $1,000
Q238: Exports are _ of spending into (from)
Q239: Suppose full employment real GDP is $13
Q240: If the government spends $1 billion to
Q241: As income increases, consumption
A) increases at a
Q243: Assume that the multiplier is 10. Full
Q244: How does the simple Keynesian model differ
Q245: One of the determinants of investment is
Q246: When the economy is in equilibrium in
Q247: Spending by federal, state, and local governments
Unlock this Answer For Free Now!
View this answer and more for free by performing one of the following actions

Scan the QR code to install the App and get 2 free unlocks

Unlock quizzes for free by uploading documents