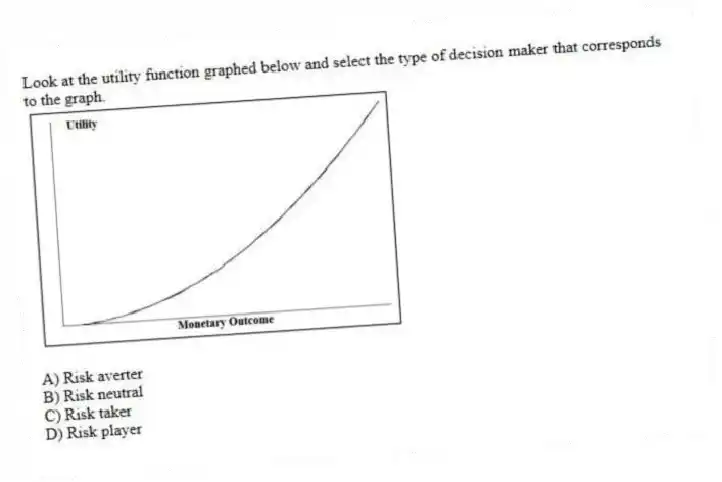
Look at the utility function graphed below and select the type of decision maker that corresponds to the graph. 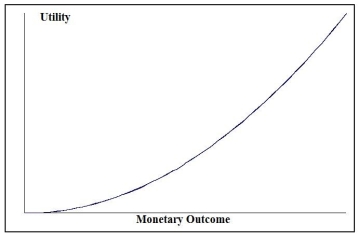
A) Risk averter
B) Risk neutral
C) Risk taker
D) Risk player
Correct Answer:
Verified
Q61: To calculate expected profit under certainty,you need
Q75: In a local cellular phone area,company A
Q76: _ is a procedure for revising probabilities
Q77: The _ curve represents the expected monetary
Q80: In a local cellular phone area,company A
Q98: The risk- _ curve represents the expected
Q276: Look at the utility function graphed below
Q280: TABLE 19-5
The following payoff table shows profits
Q281: TABLE 19-5
The following payoff table shows profits
Q282: TABLE 19-5
The following payoff table shows profits
Unlock this Answer For Free Now!
View this answer and more for free by performing one of the following actions

Scan the QR code to install the App and get 2 free unlocks

Unlock quizzes for free by uploading documents