(Figure: Determining Surplus and Loss) In the graph, how much is producer surplus at a price of $5? 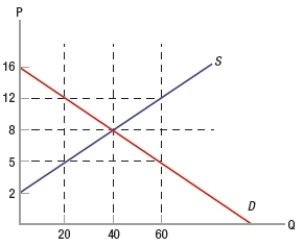
A) $30
B) $90
C) $170
D) $300
Correct Answer:
Verified
Q134: (Figure: Determining Surplus and Loss) Consider the
Q135: If consumer surplus is $6 million and
Q136: Suppose that a major hurricane hits Florida,
Q137: (Figure: Determining Surplus and Loss) In the
Q138: (Figure: Understanding Price Ceilings and Floors) In
Q140: (Figure: Determining Surplus) In the graph, the
Q141: If buyers have inadequate information about products,
Q142: (Figure: Determining Surplus) In the graph, the
Q143: The lack of easy entry into a
Q144: Suppose that a customer's willingness-to-pay for a
Unlock this Answer For Free Now!
View this answer and more for free by performing one of the following actions

Scan the QR code to install the App and get 2 free unlocks

Unlock quizzes for free by uploading documents