(Figure: Determining Surplus 5) According to the graph, at equilibrium total surplus is 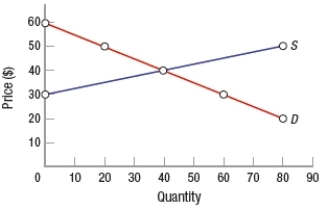
A) $600.
B) $200.
C) $1,200.
D) $80.
Correct Answer:
Verified
Q117: A good example of a government imposed-price
Q118: Which of these is the BEST example
Q119: The price of strawberries decreases from $4.10
Q120: Suppose that a customer's willingness-to-pay for a
Q121: (Figure: Determining Surplus and Loss) In the
Q123: The French term for "let it be"
Q124: Which of these would NOT yield an
Q125: The government often provides goods that are
Q126: Which of these is NOT correct? Price
Q127: (Figure: Understanding Price Ceilings and Floors) In
Unlock this Answer For Free Now!
View this answer and more for free by performing one of the following actions

Scan the QR code to install the App and get 2 free unlocks

Unlock quizzes for free by uploading documents