(Figure: Determining Surplus and Loss) In the graph, producer surplus is _____ in equilibrium and _____ at a price of $12. 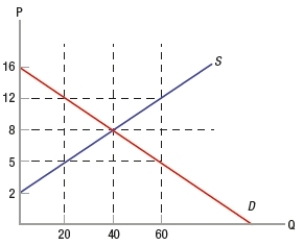
A) $0; $210
B) $160; $40
C) $120; $170
D) $120; $210
Correct Answer:
Verified
Q269: (Figure: Determining Surplus 2) In the graph,
Q270: (Figure: Determining Surplus and Loss) Consider the
Q271: Markets tend to provide too little of
Q272: The difference between market price and the
Q273: An effective price ceiling leads to
A) quantity
Q275: (Figure: Determining Surplus and Loss) In the
Q276: Markets tend to produce
A) too much of
Q277: External costs increase deadweight loss, while external
Q278: (Figure: Determining Surplus and Loss) In the
Q279: Merchants' raising prices of necessary goods during
Unlock this Answer For Free Now!
View this answer and more for free by performing one of the following actions

Scan the QR code to install the App and get 2 free unlocks

Unlock quizzes for free by uploading documents