Use the information in the following table to graph the demand curve and the supply curve for cupcakes. Label the area of deadweight loss on your graph if the price is set at $1.60. Also label the area of surplus transferred from buyers to sellers. 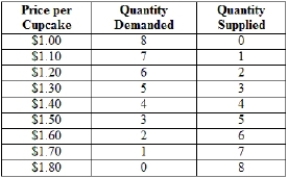
Correct Answer:
Verified
View Answer
Unlock this answer now
Get Access to more Verified Answers free of charge
Q331: What are the four major reasons markets
Q332: Most economic analyses focus on questions regarding
Q333: Will consumer surplus increase or decrease when
Q334: Give an example of asymmetric information. Explain
Q335: Which of these would create an external
Q337: Will consumer surplus increase or decrease when
Q338: Consumer surplus is shown graphically as the
Q339: Explain why governments will sometimes intervene in
Q340: Describe why governments might get involved with
Q341: Vanessa is irritated at her roommate, Carol.
Unlock this Answer For Free Now!
View this answer and more for free by performing one of the following actions

Scan the QR code to install the App and get 2 free unlocks

Unlock quizzes for free by uploading documents