(Figure: Interpreting a Market Graph) The graph represents 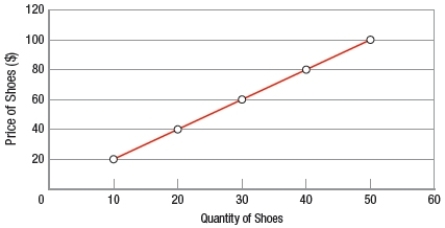
A) willingness-to-pay.
B) the price system.
C) the law of supply.
D) the law of demand.
Correct Answer:
Verified
Q4: A change in the quantity of laundry
Q5: Ceteris paribus, a decrease in the number
Q6: Which graph concerning electric vehicles indicates an
Q7: The supply curve slopes up and to
Q8: Economists often call our market economy the
Q10: The demand curve slopes downward and to
Q11: Long-term shortages and surpluses are almost always
Q12: Suppose that a person discovers that, ceteris
Q13: (Figure: Individual and Market Demand Curves) According
Q14: Willingness-to-pay is always equal to the price
Unlock this Answer For Free Now!
View this answer and more for free by performing one of the following actions

Scan the QR code to install the App and get 2 free unlocks

Unlock quizzes for free by uploading documents