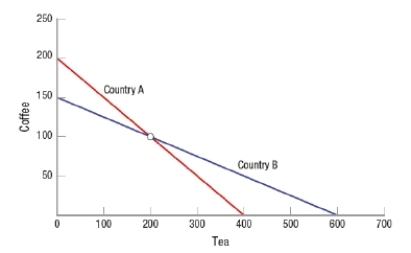
The figure below shows the production possibility frontiers for two countries, A and B. Suppose each country produces 100 tons of coffee and 200 tons of tea. How would total production rise if they were to specialize?
Correct Answer:
Verified
View Answer
Unlock this answer now
Get Access to more Verified Answers free of charge
Q240: Which of these is a limitation of
Q241: The table below shows data for the
Q242: Compare and contrast tariffs and quotas. Use
Q243: Explain the following statement: "With international trade,
Q244: Why does the presence of diminishing returns
Q246: Describe the terms of trade and how
Q247: The table below shows data for the
Q248: Which sector represents the largest component of
Q249: Describe four economic arguments traditionally used against
Q250: List and evaluate three often-cited concerns over
Unlock this Answer For Free Now!
View this answer and more for free by performing one of the following actions

Scan the QR code to install the App and get 2 free unlocks

Unlock quizzes for free by uploading documents