(Figure: Determining Curves) The curve in the graph represents a _____ curve. 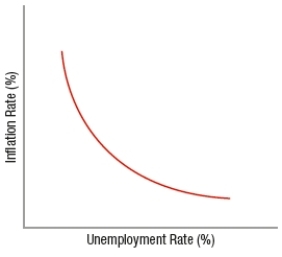
A) demand
B) Phillips
C) labor demand
D) production possibilities
Correct Answer:
Verified
Q151: In the short run, unanticipated inflation usually
Q152: (Figure: Understanding Phillips Curve Shifts) The graph
Q153: The possible consequences of using fiscal and
Q154: The Phillips curve shows the tradeoff between
Q155: Increased outsourcing by U.S. companies has contributed
Q157: According to the equation for the Phillips
Q158: (Figure: Aggregate Supply and Demand Shifts) The
Q159: If wages increase 4% faster than productivity,
Q160: Social Security payments rise according to the
Q161: When the cost of health care increases,
Unlock this Answer For Free Now!
View this answer and more for free by performing one of the following actions

Scan the QR code to install the App and get 2 free unlocks

Unlock quizzes for free by uploading documents