(Figure: Laffer Curve) The graph shows a hypothetical Laffer curve. If the tax rate is 80%, the 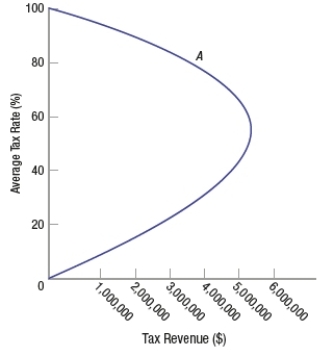
A) government should reduce the rate to 50% to maximize tax revenue.
B) tax rate should be increased to 100% to maximize tax revenues.
C) tax rate is at its optimal level.
D) tax rate should be reduced to zero to maximize tax revenue.
Correct Answer:
Verified
Q242: Which of these countries has the largest
Q243: (Figure: Laffer Curve 2) The figure shows
Q244: Which statement is TRUE regarding the possible
Q245: Lowering marginal tax rates and increasing government
Q246: One argument against using taxation to pay
Q248: Suppose the U.S. government decides to pay
Q249: If interest rates rise, the burden of
Q250: GDP equals investment plus savings.
Q251: If interest rates fall, the burden of
Q252: Using demand-side fiscal policy to stimulate aggregate
Unlock this Answer For Free Now!
View this answer and more for free by performing one of the following actions

Scan the QR code to install the App and get 2 free unlocks

Unlock quizzes for free by uploading documents