(Figure: Education and Earnings) The data in the graph show the relationship between years of education and salary. Which statement is NOT correct? 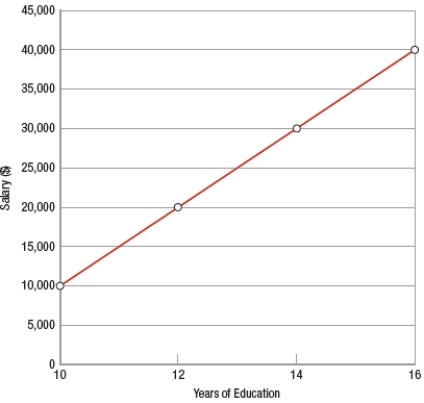
A) A person with 13 years of education can expect to earn $25,000.
B) The slope of the line is 5,000.
C) The line represents a simple model of the relationship between education and earnings.
D) The relationship between the two variables is nonlinear.
Correct Answer:
Verified
Q94: Economic models must fully reflect reality.
Q95: When government policies are being designed
A) there
Q96: Which of these is NOT an example
Q97: Thinking at the margin is defined as
Q98: Which situation(s) may require government intervention? I.
Q100: The situation in which markets fail to
Q101: The concept of scarcity implies that people
Q102: Economists generally have _ to say about
Q103: Model building leads to theories that must
Q104: Production inefficiency implies that
A) goods are produced
Unlock this Answer For Free Now!
View this answer and more for free by performing one of the following actions

Scan the QR code to install the App and get 2 free unlocks

Unlock quizzes for free by uploading documents