(Figure: Graph Interpretation) In the graph, the equation for the line is 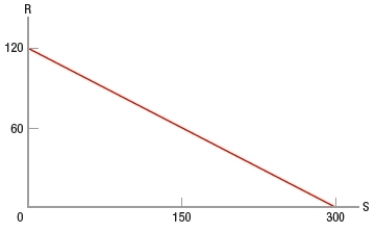
A) R = 120 - 0.4S.
B) R = 120 - 300S.
C) R = 120 + 0.4S.
D) R = 300 + 120S.
Correct Answer:
Verified
Q251: Economics is BEST defined as the study
Q252: Which statement is a key idea in
Q253: It is impossible to have a conflict
Q254: The assumption that people will act in
Q255: Macroeconomics focuses on decisions made for the
Q257: (Figure: Interpreting Equations on a Graph) In
Q258: Scarcity is BEST defined as when
A) the
Q259: Thinking at the margin involves
A) influencing how
Q260: In the equation S = 130 -
Q261: (Table) If the numbers in the table
Unlock this Answer For Free Now!
View this answer and more for free by performing one of the following actions

Scan the QR code to install the App and get 2 free unlocks

Unlock quizzes for free by uploading documents