(Figure: Weight Loss and Exercise Time) According to the data in the graph, where weight loss is shown on the y axis, every two extra hours of exercise 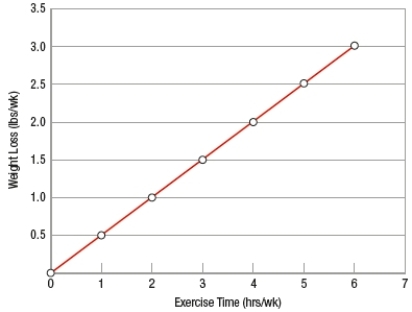
A) decreases weight by ½ a pound.
B) increases weight by ½ a pound.
C) decreases weight by 1 pound.
D) increases weight by 1 pound.
Correct Answer:
Verified
Q286: If a student were not studying economics,
Q287: Time series graphs allow us to see
Q288: In the equation S = 130 -
Q289: Generally speaking, private markets are the most
Q290: Evaluate this statement: There is more than
Q292: _ occur(s) when goods are produced at
Q293: A question whose answer is based on
Q294: A recent decision regarding the Federal Reserve's
Q295: Economists tend to look
A) at costs but
Q296: Which topic is MOST likely to be
Unlock this Answer For Free Now!
View this answer and more for free by performing one of the following actions

Scan the QR code to install the App and get 2 free unlocks

Unlock quizzes for free by uploading documents