Multiple Choice
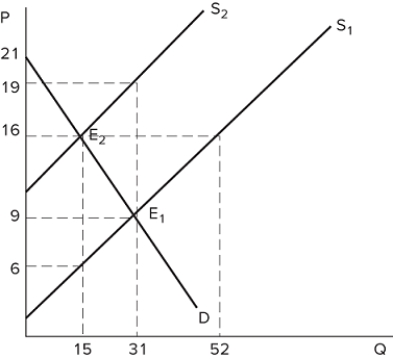 The graph shown demonstrates a tax on sellers. After the tax has been imposed, the sellers produce _______ units, and the post-tax price received for each one sold is _______.
A) 15; $16
B) 15; $6
C) 31; $9
D) 31; $19
Correct Answer:
Verified
Related Questions

