Multiple Choice
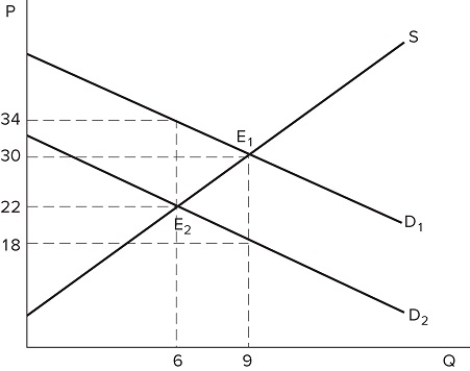 The graph shown demonstrates a tax on buyers. After the tax has been imposed, sellers produce _______ units, and the post-tax price received for each one sold is _______.
A) 6; $22
B) 6; $34
C) 9; $18
D) 9; $30
Correct Answer:
Verified
Related Questions
Q128: If sellers bear a greater tax burden
Q129: Does a tax on buyers affect the
Q130: When a tax is placed on buyers:
A)
Q131: Q132: If the supply curve is more inelastic Q134: If the demand curve is less elastic Q135: Does a tax on buyers affect the![]()
Unlock this Answer For Free Now!
View this answer and more for free by performing one of the following actions

Scan the QR code to install the App and get 2 free unlocks

Unlock quizzes for free by uploading documents