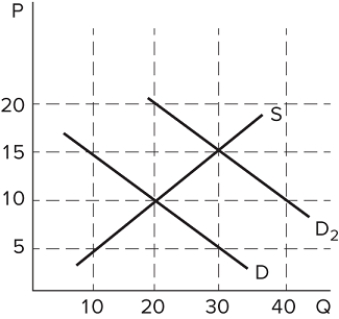
 Assume the graph shown represents the market for button-up shirts and was originally in equilibrium where demand (D) and supply (S) intersect. What type of shock might cause the demand curve to shift to D2?
A) An increase in the price of buttons
B) An increase in the price of ties
C) An increase in the price of sweatshirts
D) An increase in consumers' incomes
Correct Answer:
Verified
Q84: Q85: Wendell just read an article claiming scientists Q86: Supply describes how much of something producers: Q87: Ren loves to go to the movies, Q88: Juan goes to his favorite store to Q90: For almost all goods, the _ the Q91: A table that shows the quantities of Q92: How should you plot a supply curve Q93: The law of supply states that, all Q94: ![]()
A)![]()
Unlock this Answer For Free Now!
View this answer and more for free by performing one of the following actions

Scan the QR code to install the App and get 2 free unlocks

Unlock quizzes for free by uploading documents