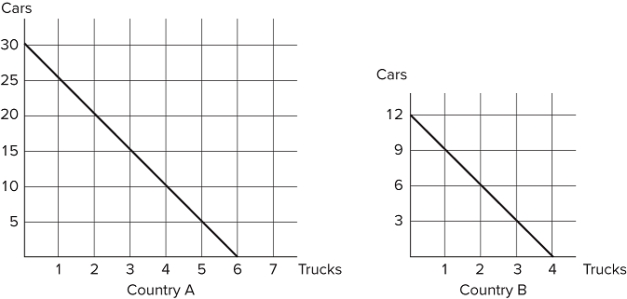
 Refer to the figure shown, which represents the production possibilities frontiers for Countries A and B. The slope of Country A's production possibilities frontier:
A) measures the opportunity cost of trucks in terms of cars.
B) measures the trade-off that Country A faces when deciding how to allocate resources.
C) is constant, because the opportunity cost remains constant.
D) All of these statements are true.
Correct Answer:
Verified
Q46: Suppose that a worker in Country A
Q47: Suppose that a worker in Country A
Q48: When a country is producing goods and
Q49: Tom and Jerry have one day to
Q50: Suppose that a worker in Country A
Unlock this Answer For Free Now!
View this answer and more for free by performing one of the following actions

Scan the QR code to install the App and get 2 free unlocks

Unlock quizzes for free by uploading documents