Multiple Choice
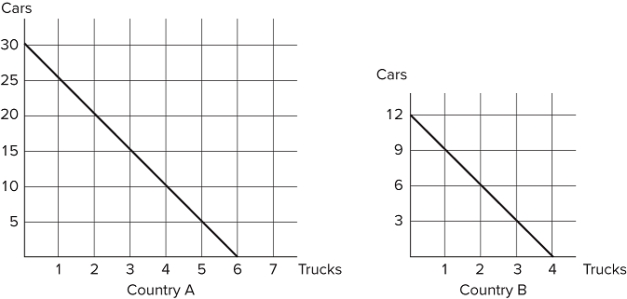 Refer to the figure shown, which represents the production possibilities frontiers for Countries A and B. Why are these graphs not realistic representations of actual countries?
A) The production possibilities frontiers are straight lines rather than bowed out.
B) They only represent the production of two goods.
C) They only represent two countries.
D) All of these statements are reasons why these graphs are not realistic representations.
Correct Answer:
Verified
Related Questions

