The graph shown displays various price and output levels in an economy. 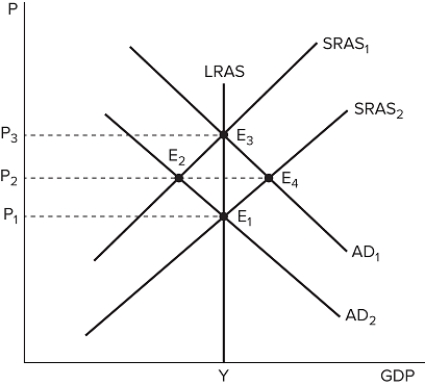 What does the "Y" on the x-axis stand for?
A) Full employment level of output
B) Current level of GDP
C) Observed level of output
D) Future target goal for output
Correct Answer:
Verified
Q18: To measure core inflation, the BLS removes
Q19: Which measure of inflation best reflects changing
Q20: The table shown provides CPI values for
Q21: The classical theory of inflation:
A) describes a
Q22: Neutrality of money is the idea that:
A)
Q24: During a bout of hyperinflation, suppose the
Q25: The graph shown displays various price and
Q26: The money value of goods or services
Q27: The graph shown displays various price and
Q28: In the long run, an increase in
Unlock this Answer For Free Now!
View this answer and more for free by performing one of the following actions

Scan the QR code to install the App and get 2 free unlocks

Unlock quizzes for free by uploading documents